
The betting odds do not know anything the polls don’t. That myth deserves an early death, because it drives most of the bad takes about prediction markets vs polls. Traders on regulated exchanges are not running secret focus groups in Ohio. They are reading the same generic ballot averages you are, plus some fundraising numbers, some special election results, and a lot of each other’s order flow. The market’s advantage, where it exists, is in how fast it digests that information and how it expresses the answer, not in having better information.
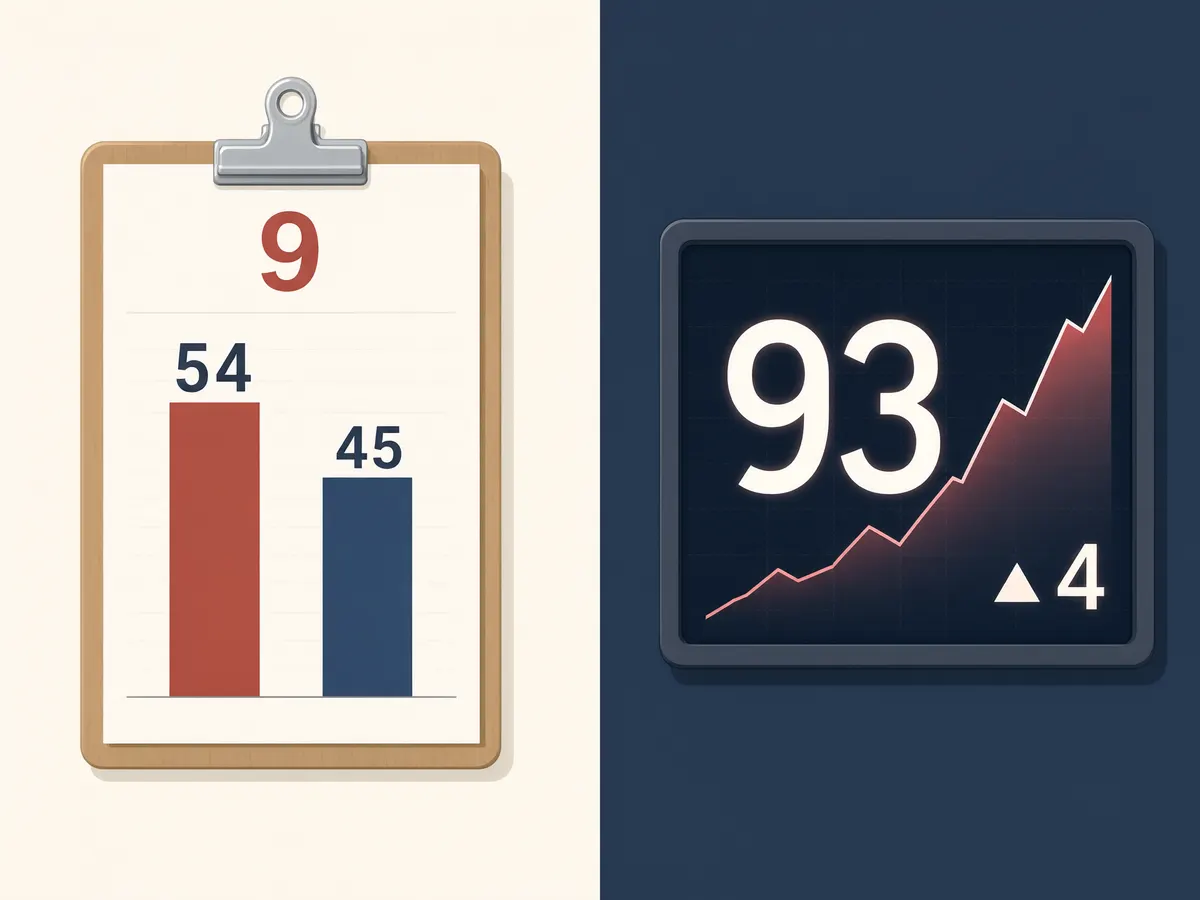
Which brings us to the two numbers sitting side by side as the 2026 midterms approach. In early October, the generic congressional ballot had Democrats ahead by roughly 9 points, and prediction markets priced Democratic control of the House at about 93%. Same direction, completely different units. If you can explain why those two figures are not the same claim, you already understand most of what follows.
Step one: separate a margin from a probability
A poll estimates a quantity. The generic ballot asks which party’s candidate you’d back for Congress and produces an average margin, D+8.9 or whatever the current number is, with a margin of error attached. It says nothing directly about who wins the chamber, because House control depends on 435 district-level results, incumbency, and a map that does not convert votes to seats at a 1:1 rate.
An event contract prices an outcome. “Democrats win control of the House” either happens or it doesn’t, and the contract settles accordingly. A price of 93 cents is a statement about likelihood, not about size of victory. A party can win the House by two seats and the contract still pays in full.
So the honest translation of those two numbers is: polls say the national mood currently leans one way by a high single-digit margin; the market says traders think that lean, filtered through the map, makes one outcome very likely. You can agree with the first and disagree with the second without contradicting yourself.
| What you’re looking at | Opinion polls | Event-contract markets |
|---|---|---|
| Output | Estimated vote share or margin | Probability of a specific outcome |
| Source of the number | Sampled respondents, weighted | Prices set by traders risking money |
| Uncertainty shown as | Margin of error, confidence interval | The price itself, plus bid-ask spread |
| Update speed | Days (fieldwork, then averaging) | Continuous, within hours of news |
| Main weakness | Response bias, likely-voter modelling | Thin volume on small races, herding |
Step two: learn how prediction markets price odds
Mechanically, this is simpler than people expect. A binary event contract is worth $1 if the stated event occurs and $0 if it doesn’t. Traders buy and sell it in between. If the last trade was at 93 cents, the market is implying roughly a 93% chance, because that is the price at which a buyer is indifferent between paying 93 cents now and collecting a dollar later.
Kalshi event contracts work this way on a federally regulated exchange, with the Commodity Futures Trading Commission overseeing the venue rather than a state gaming board. That regulatory route is why election-related contracts ended up in court rather than in a sportsbook. The reporting and settlement rules of a CFTC-regulated market are closer to futures trading than to a parlay slip, even though the user experience looks like betting.
Two things stop the price from being a pure probability:
- Costs. Spreads, fees and the opportunity cost of capital tied up until resolution all push prices slightly away from a clean belief. A contract resolving a year out is worth less than its “true” probability simply because money is locked up.
- Who’s trading. Prices reflect the people in the room, weighted by how much they’re willing to risk. A handful of large, confident positions can move a thin market more than a thousand well-sampled voters can move a polling average.
If you ever want the familiar betting equivalent, the conversion is one division.
| Contract price | Implied probability | Decimal-odds equivalent |
|---|---|---|
| 93¢ | 93% | 1.08 |
| 75¢ | 75% | 1.33 |
| 50¢ | 50% | 2.00 |
| 25¢ | 25% | 4.00 |
| 10¢ | 10% | 10.00 |
Step three: check the track record before you lean on it
This is where the “markets beat polls” slogan falls apart, because the research genuinely splits.
The case for markets rests heavily on the Iowa Electronic Markets, the long-running academic exchange. A review of its performance found the market beat the matching poll in roughly 74% of head-to-head comparisons across five presidential cycles. That is a real result and it is why economists took the idea seriously in the first place.
The case against is just as credible. A widely cited 2012 study by Robert Erikson and Christopher Wlezien looked at decades of election markets and concluded that once scientific polling matured in the 1930s, markets stopped adding predictive value over polls. In their reading, the market was mostly repackaging the polls with extra noise.
The 2024 cycle gave us a fresher data point, and it cuts both ways. A 2025 analysis led by economist Rajiv Sethi found Polymarket’s national forecasts for the popular vote and Electoral College landed roughly in line with standard statistical models, not meaningfully ahead of them. The same research found markets did noticeably worse than the models down the ballot, especially on Congressional races where trading volume and public attention are thin.
That down-ballot gap matters enormously for midterm forecasts, because midterms are down-ballot. A chamber-control contract on a major exchange will attract serious volume. A contract on a single competitive House seat in a district nobody outside it can name will not.
Step four: ask how thin the market is, and which market it is
Accuracy is not a property of “prediction markets” as a category. It varies by venue. Across 2024 election markets, one platform resolved about 93% of its contracts correctly while another came in closer to 67%. That is not a rounding difference, and it tells you the label on the exchange is part of the signal.
Before you treat a price as information, look at three things: how much volume the contract has traded, how wide the bid-ask spread is, and whether the question is worded tightly enough to resolve cleanly. A 7% implied chance on a contract with a 5-cent spread and almost no trades is not a forecast. It’s a quote.
Step five: use markets for speed, polls for level
The clearest edge markets showed in 2024 was reaction time. When real-time events hit, prices moved within hours. Polling averages took days, because someone has to field a survey, weight it, publish it, and wait for the average to absorb it. If you want to know how a debate or an indictment or a withdrawal changed expectations before dinner, the market is the only live instrument on the table.
Polls remain better at telling you the level: how large the gap is, among whom, and on which issues. Crosstabs exist. Market prices have no crosstabs. “93%” cannot tell you whether suburban women moved or turnout assumptions changed, and a trader who thinks they know will usually be quoting a pollster anyway.
The practical approach for following the 2026 midterms is to read them as two instruments, not two competitors. Generic ballot for the direction and size of the national swing. Chamber-control contracts for a continuously updated probability that the swing is enough. Individual-seat contracts with heavy scepticism, since that is precisely where the 2024 research found markets wobble.
Step six: do the arithmetic yourself before you believe the headline
A 93% price means the market expects the other outcome roughly one time in fourteen. One-in-fourteen events happen constantly. If the contract resolves the unlikely way, that is not proof the market was “wrong” any more than a 7% chance of rain that arrives proves the forecaster was a fraud. You can only judge calibration across many events: do the things priced at 90% actually happen about nine times out of ten?
That is the question serious researchers ask about polling accuracy too, and it’s why both camps can produce a defensible scoreboard. Pick a metric, pick a set of races, and the answer shifts.
A note on the money side
None of this is a trading plan, and the structure of these markets makes that worth stating plainly. Event contracts carry spreads and fees, your capital is locked until resolution, and the person on the other side of your order may be better informed than you. The average participant in any costed market loses to those costs over time, the same way the average slots session loses to the house edge. Availability also depends entirely on where you live and which venues are permitted there.
If you follow these markets for the forecasting signal, treat the money as the price of admission rather than the point. Set a limit before you open the app, keep the stake small enough to be irrelevant to your month, and use the deposit and loss limits the platform offers. If it stops feeling like curiosity, stop.
Leftover questions worth answering
Is a 93% market price the same as a 93% model forecast?
Not quite. A statistical model produces its number from stated assumptions you can inspect. A market price is an aggregate of opinions, some of which are copies of that model. The two often agree because the market is partly reading the model.
Why do markets look sharper on presidential races than on midterm forecasts?
Volume and attention. A presidential contract attracts enough informed capital to punish mispricing quickly. A single House district contract may trade a few thousand dollars, which is not enough liquidity for the wisdom-of-crowds effect to do much work.
So which should I trust heading into November?
Both, for different jobs, and neither as prophecy. The polls and the markets currently point the same way on House control, which is mildly reassuring but not independent confirmation, since one is an input to the other. When they diverge sharply, that’s the interesting moment, and usually the moment to go read what changed rather than pick a winner.